Dashboard and activity
The one screen that answers 'where are we?' — pipeline counts, pacing, and the specific things quietly waiting on someone.
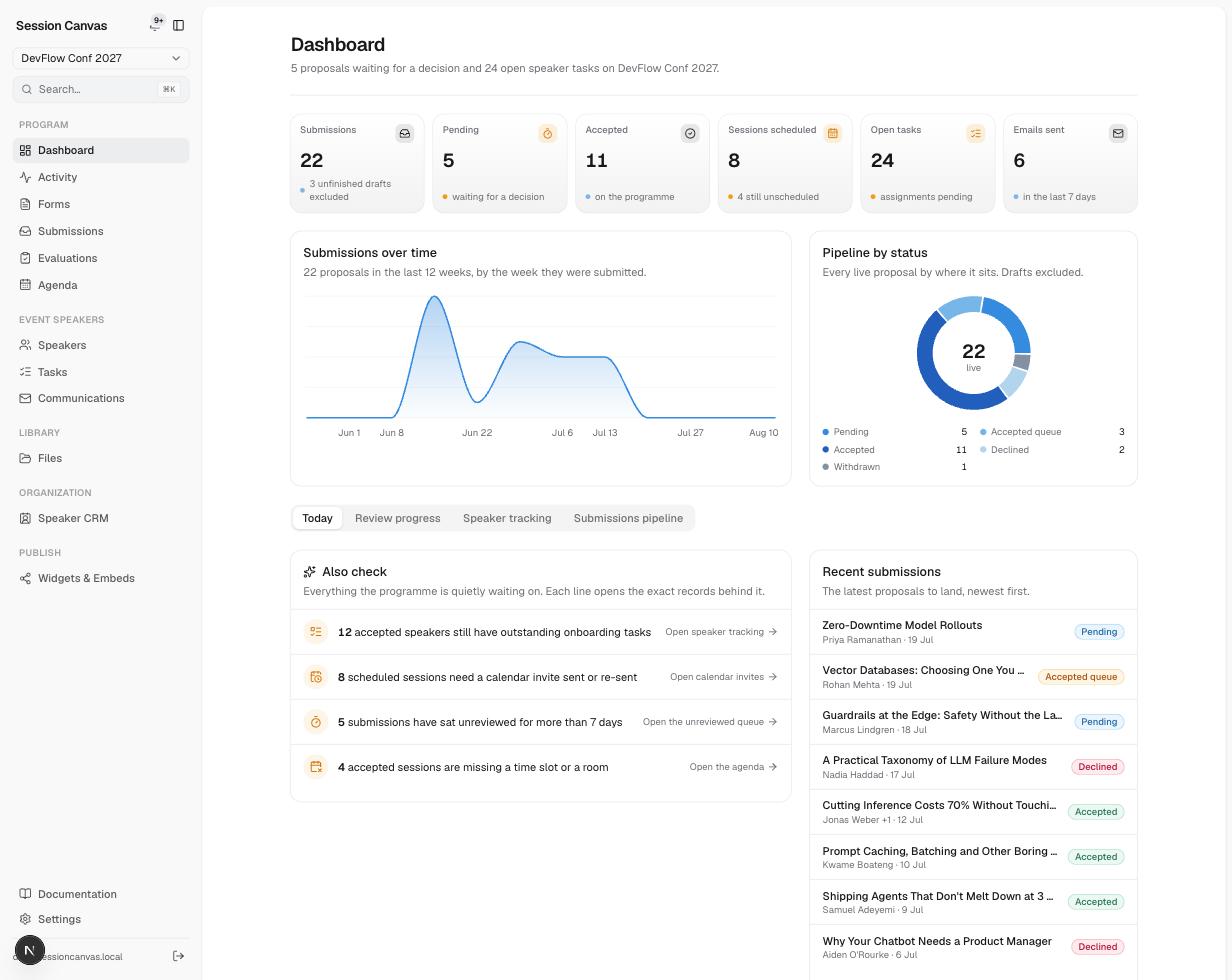
What’s on it
- KPI cards — submissions (drafts excluded), pending decisions, accepted, sessions scheduled (with how many are still unscheduled), open tasks, and emails sent in the last 7 days. Each card links into the module behind the number.
- Submissions over time — proposals per week for the last 12 weeks, so you can see the pre-deadline surge forming.
- Pipeline by status — every live proposal by where it sits.
- Tabs — Today, Review progress, Speaker tracking (which accepted speakers still owe onboarding tasks — the answer to “who do I chase?”), and Submissions pipeline.
- Recent submissions — the latest proposals with their status, newest first.
The “Also check” list
The dashboard’s most useful block is a plain list of things quietly waiting on someone, each line opening the exact records behind it:
- accepted speakers with outstanding onboarding tasks → opens speaker tracking
- scheduled sessions that need a calendar invite sent or re-sent → opens calendar invites
- submissions that have sat unreviewed for more than 7 days → opens the unreviewed queue
- accepted sessions missing a time slot or a room → opens the agenda
Activity and notifications
Activity in the sidebar is the event’s audit trail — submissions, status changes, portal edits, sends — and feeds the bell icon in the sidebar header, which counts what’s new since you last looked. Speaker profile edits show up here too, so a bio changed via the portal never goes unnoticed.